
How manufacturing competitiveness metrics reveal hidden cost gaps
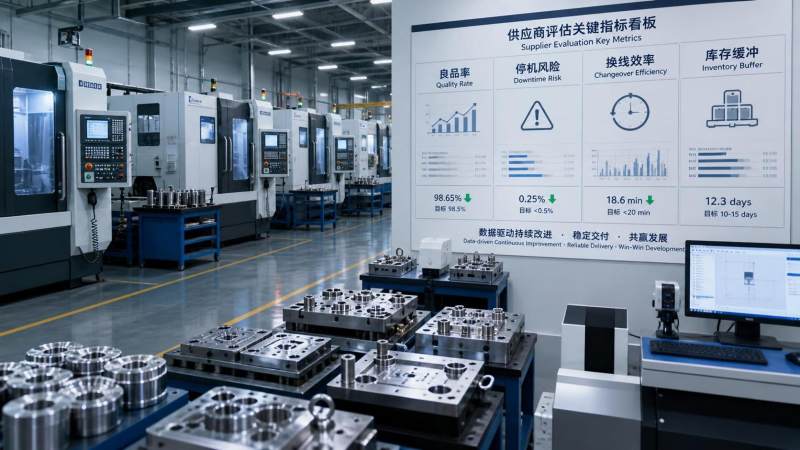
Many sourcing teams think they are comparing suppliers on price, lead time, and quality. In practice, that view is often too shallow. Manufacturing competitiveness metrics can expose where the real cost gaps sit: unstable process capability, hidden scrap, maintenance-driven downtime, excess inspection, inventory buffers, tooling losses, and material volatility that never appears clearly in the quoted unit price. If you are evaluating suppliers, plants, or production strategies, the point is not to collect more dashboards. It is to see which numbers actually explain why one source becomes expensive six months after award.
A direct answer, in simple terms: manufacturing competitiveness metrics reveal hidden cost gaps by connecting operational performance with commercial outcomes. When yield drops, changeover stretches, machine uptime slips, or supplier variability rises, the financial impact usually shows up later as rush freight, larger safety stock, warranty exposure, and rework costs. Looking at price alone misses that chain.
Why the quoted price is usually the least reliable cost signal
A low quote can be genuine. It can also be a temporary snapshot that ignores process instability. This is common in precision machining, die-casting, fastening systems, pump assemblies, and lubricant-dependent production environments, where small technical deviations create large commercial consequences.
Take two suppliers offering nearly the same part. One is slightly more expensive on paper. The other looks cheaper by 4%. Many buyers stop there. But if the lower-priced source runs wider process variation, needs more final inspection, has weaker tooling life control, or depends on volatile raw material purchasing, that 4% gap can disappear quickly. Then the hidden costs start arriving in pieces: delayed shipments, extra incoming inspection, emergency substitutions, and higher defect sorting at your site.
This is why strong business evaluators look for metrics that explain cost behavior over time, not just cost at order placement.
Which manufacturing competitiveness metrics actually uncover cost gaps
Not every metric deserves equal attention. Some are useful for operations, but weak for sourcing decisions. Others are highly predictive of future cost leakage.
The most revealing metrics usually sit in five groups.
- Process stability: first-pass yield, scrap rate, rework rate, Cp/Cpk where relevant, and deviation trends by machine, mold, or line.
- Asset performance: uptime, unplanned downtime frequency, mean time between failures, and maintenance response discipline.
- Flow efficiency: cycle time consistency, setup/changeover time, queue time, and schedule adherence.
- Supply resilience: on-time delivery performance, raw material exposure, supplier concentration, and recovery time after disruption.
- Cost absorption behavior: labor efficiency, tooling consumption, energy intensity, inspection burden, and inventory days required to keep service levels stable.
What matters is not just the metric itself, but what cost category it predicts.
That is the practical use of metrics. They help you estimate the costs that do not show up in a quote sheet.
The cost gaps that stay hidden until the contract is already signed
Some cost gaps are obvious, such as high scrap. Others are quieter and more expensive because they spread across departments.
One of the most overlooked examples is inspection drag. A supplier with unstable quality may still hit acceptable outgoing quality by adding manual checks, sorting, and containment. On paper, defect rates can look manageable. In reality, the process is expensive and fragile. If volume rises or a key inspector leaves, performance deteriorates fast. The buyer then pays indirectly through incoming inspection hours, approval delays, and production scheduling friction.
Another common blind spot is downtime masked by inventory. A plant with poor equipment reliability can appear dependable if it carries enough finished goods. That buffer has a cost: working capital, warehouse space, obsolescence risk, and weaker responsiveness to engineering changes. The metric you need is not only service level, but how much inventory is required to maintain it.
Material usage is another area where business teams get misled. In high-value materials such as specialty alloys, engineered resins, or performance lubricants, small losses matter. If a supplier has weak yield control, poor nesting, inefficient gating design, or inconsistent fluid management, the real cost structure is much higher than the quoted conversion rate suggests. Unless the evaluator asks how yield is maintained, the quote can look deceptively competitive.
Where evaluators often misread the numbers
A frequent mistake is treating all factories as if the same KPI thresholds mean the same thing. They do not.
For example, a 92% yield rate may be acceptable in one rough-process environment but alarming in a tight-tolerance precision machining workflow. A high changeover time may be normal for complex multi-axis parts with difficult qualification requirements, but a warning sign for standardized fastening or sealing production. Context matters: process complexity, tolerance stack-up, regulatory burden, and batch mix all change what “good” looks like.
Another mistake is relying on monthly averages. Averages hide volatility, and volatility creates cost. Two suppliers can both report 95% on-time delivery, but one gets there steadily while the other swings between early and late shipments. The second supplier usually forces the buyer to carry more buffer stock or spend more time in exception management. A stable average and a volatile average do not have the same commercial value.
One more caution: do not confuse certification with competitiveness. ISO, DIN, ASME, or JIS alignment can be essential depending on the category, but standards compliance alone does not prove an efficient cost structure. It proves a baseline of control or conformance. The hidden cost question is still operational: how consistently does the supplier achieve that standard, and at what resource intensity?
How to use manufacturing competitiveness metrics in sourcing decisions
The strongest approach is to connect technical metrics to total landed cost scenarios.
Instead of asking, “Who has the lowest price?” ask a sharper set of questions:
- Which supplier needs the least inventory buffer to stay reliable?
- Which one shows the most stable process capability over time?
- Where is raw material price exposure highest, and how is it managed?
- Which source is likely to create extra quality overhead on our side?
- If demand changes suddenly, who can respond without cost spikes?
This changes the evaluation model. You stop comparing quotes and start comparing operating risk.
In real procurement work, that often means building a weighted scorecard that includes price, but does not let price dominate by default. A slightly higher-cost supplier can still be the lower-cost option after you account for downtime exposure, delivery reliability, tooling discipline, and engineering responsiveness. That is especially true for categories where failure costs are disproportionate, such as critical machined parts, pump systems, mechanical seals, or production-line consumables that affect uptime.
For teams that need a technical benchmark rather than vendor claims, a data-led reference source can help. G-PME is one example of a platform built around precision manufacturing intelligence, with coverage across CNC machining, fastening and sealing systems, fluid control and pump systems, die-casting and mold engineering, and industrial lubricants and functional chemicals. Its value is not that it replaces supplier due diligence. Its value is that it helps evaluators frame the right questions around standards, materials, operational resilience, and performance comparability.
What a good cost review looks like before supplier selection
If the part, assembly, or industrial input is commercially important, review the quote in layers.
Start with direct price, then pressure-test the assumptions underneath it. Ask how the supplier controls scrap, what uptime level is normal on the relevant line, how often tooling is replaced or requalified, what portion of lead time is queue versus run time, and whether material purchasing is spot-based or contract-based. None of those questions are academic. Each one points to a cost shock that may surface later.
Then look for cost transfer. Some suppliers keep their quote low by shifting work to the customer: tighter order windows, larger minimum batches, more drawing clarifications, more approval cycles, more incoming inspection, or greater packaging and handling constraints. The quote stays attractive because the burden is moved, not removed.
This is where experienced evaluators separate cheap from efficient.
When these metrics are less useful
There are cases where manufacturing competitiveness metrics have limited value on their own. If you are buying a low-criticality commodity with broad market supply and low switching cost, deep operational analysis may not change the outcome much. In that case, commercial leverage, contract terms, and logistics often matter more.
They are also less useful when the underlying data quality is weak. If a supplier cannot define how it measures downtime, yield, or on-time delivery, the dashboard may create false confidence. In those situations, shop-floor observation, audit evidence, sample history, and trial orders matter more than polished KPI slides.
That distinction matters. Metrics are decision tools, not decoration.
What to check next if you are comparing suppliers right now
If you are in an active sourcing cycle, focus on three things first: variability, recovery, and cost transfer.
Variability tells you whether the current quote is supported by a repeatable process. Recovery tells you how the supplier behaves when something goes wrong. Cost transfer shows whether the apparent savings are simply being moved into your inventory, QA, maintenance, or planning functions.
That is where manufacturing competitiveness metrics become commercially useful. They do not just describe factory performance. They reveal whether a supplier’s price is structurally sound, temporarily convenient, or quietly expensive.
FAQ
Are manufacturing competitiveness metrics only useful for large industrial buyers?
No. Larger companies may have better data access, but even mid-sized buyers can use a small set of metrics to spot risk. Yield stability, on-time delivery consistency, and downtime exposure already provide a strong filter.
What is the first metric to check when cost overruns keep appearing after award?
Usually process stability. First-pass yield and rework trends often explain why actual cost drifts away from quoted cost.
Can a supplier have good quality and still be high risk on cost?
Yes. A supplier may achieve acceptable quality through heavy inspection, overtime, or excess inventory. That can protect quality in the short term while hiding an inefficient cost base.
Should price ever outweigh the metrics?
Yes, in low-criticality categories with broad substitution options and limited downstream failure cost. In complex or uptime-sensitive categories, price alone is usually a weak decision anchor.
Image Placeholder List
- - Suggested placement: after the table comparing metrics, signals, and hidden cost gaps; Suggested image: a sourcing evaluation flow linking shop-floor metrics to total cost impact; Alt text: “Manufacturing metrics mapped to hidden cost drivers in supplier evaluation”
Internal Link Anchor Text Suggestions
- supplier performance benchmarking: suggested link to a benchmarking or vendor evaluation page
- total landed cost analysis: suggested link to a procurement cost methodology page
- precision machining quality standards: suggested link to a technical standards or machining page
- industrial supplier risk assessment: suggested link to a supply-chain resilience topic page
- how to compare CNC machining vendors: suggested link to a category-specific sourcing guide
External Authority Source Suggestions
- industry association reports on manufacturing productivity, quality, and supply-chain resilience
- government manufacturing or trade agency data on industrial costs, output, and material trends
- official technical standards documentation from ISO, ASME, DIN, or JIS-related bodies
Recommended News
 What to verify before using supplier sourcing solutions in EuropeSupplier sourcing solutions Europe: verify capabilities, compliance, traceability, total cost, and supply resilience before choosing reliable industrial partners.
 When smart fabrics are reliable enough for industrial wearablesSmart fabrics for industrial wearables: learn how to validate durability, signal quality, cleaning resilience, and safe failure performance before deployment.
 How supply chain management for exporters reduces customs delaysSupply chain management for exporters helps prevent customs delays with accurate data, origin checks, importer readiness, and proactive shipment controls. Explore practical strategies now.
 What to verify before approving an OEM electronics supplierOEM electronics supplier approval checklist: verify BOM control, traceability, testing, sourcing risk, capacity, and commercial terms before committing to volume production.
 When do CNC-machined precision components require five-axis milling?Precision components CNC machined with five-axis milling deliver better access, tighter datum control, and lower setup risk. Learn when five-axis machining is the smart choice.
 What should a restaurant POS system handle during a lunch rush?restaurantPOSsystems keep lunch rushes moving with fast ordering, smart kitchen routing, flexible payments, live inventory, and reliable service controls.
 How CNC controller cycle time speed affects machining throughputCNC controller cycle time speed can raise machining throughput by sustaining feed rates on complex toolpaths. Learn how to optimize CAM, look-ahead, and machine dynamics.
 When a 4 axis vertical machining center is the better fit than 3-axisDiscover when a 4 axis vertical machining center outperforms 3-axis machining—reduce setups, improve datum control, and boost efficiency for complex multi-face parts.
 When industrial fasteners bolts need traceable material certificationIndustrial fasteners bolts need traceable material certification for critical applications. Learn what QA teams should verify to reduce risk and ensure compliance.
 How to size pump systems for cooling circuits for stable flow ratesPump systems for cooling circuits: learn how to match flow, total dynamic head, NPSH, and controls for reliable, energy-efficient cooling performance.
 When does software as a service reduce CNC data management costs?Software as a service can lower CNC data management costs by reducing IT overhead, manual reporting, and disconnected records. Discover when SaaS delivers measurable savings.
 CNC investment trends 2026: are automation upgrades taking priority?CNC investment trends 2026 reveal why automation upgrades are reshaping capacity plans. Compare robots, pallet systems, and new machines for smarter CNC growth.
 How to size high pressure pumps for stable chemical injection ratesHigh pressure pumps sizing guide for stable chemical injection rates—learn how to balance flow range, pressure, suction conditions, materials, and controls for reliable dosing.
 When organic chemicals are suitable feedstocks for synthetic lubricantsOrganic chemicals can unlock high-performance synthetic lubricants. Learn how purity, stability, compatibility, and supply control shape reliable industrial formulations.
 What machine tool market size reveals about capital spending cyclesMachine tool market size reveals capital spending cycles through order mix, automation, replacement demand, and capacity signals. Discover what drives smarter investment decisions.
 What causes solar inverters to trip repeatedly after installationSolar inverters tripping repeatedly? Discover key causes, from grid voltage and DC faults to wiring, settings, heat, and practical troubleshooting steps.
 How a tool life calculation chart improves cutting parameter decisionsTool life calculation chart insights help optimize cutting speed, feed, and depth for predictable tool changes, better part quality, and lower machining costs.
 What to check before choosing an industrial lubricating oils factoryIndustrial lubricating oils factory selection guide: compare quality control, formulation fit, traceability, technical support, and total cost to reduce downtime risks.
 Where machine shop digital transformation delivers the fastest paybackMachine shop digital transformation delivers faster payback by reducing downtime, setup delays, quality risks, and capacity constraints with focused, measurable workflows.
 When a semiconductor manufacturing solutions provider can shorten process ramp-upA semiconductor manufacturing solutions provider can shorten ramp-up through validated hardware, change control, field support, and resilient supply chains.
 How to evaluate CNC tooling suppliers in Europe for repeatable precisionCNC tooling Europe: learn how to evaluate suppliers for repeatable precision, stable tool life, application support, traceability, and resilient delivery.




















Search News
Popular Tags